
As part of Data Analytics & Metrics, I conducted a content, peak, sentiment & network analysis of over 6,600 tweets about ‘Operation Transformation’; based on the findings I made recommendations for future Twitter strategies.
Challenge
- Analysis 6,678 tweets, retweets and replies over a period of time from 12am on 1st January 205 to midnight on 28th February 2015
- Report on the content of the tweets, provide significant insights about the trends, users and sentiment and interrupt these insights to make recommendation for future marketing activities
Solution
- Descriptive, content, peak, sentiment, and network analyses were conducted.
- Tweet findings included:
- Most active users
- Most frequent tweet day/time
- Location of tweets
- Most occurring words
- Sentiment distribution
Tools/Software Used
- Microsoft Excel
- SQL
- Google Big Query
- R-Studio
- Tableau
- Gephi
Sample of Results
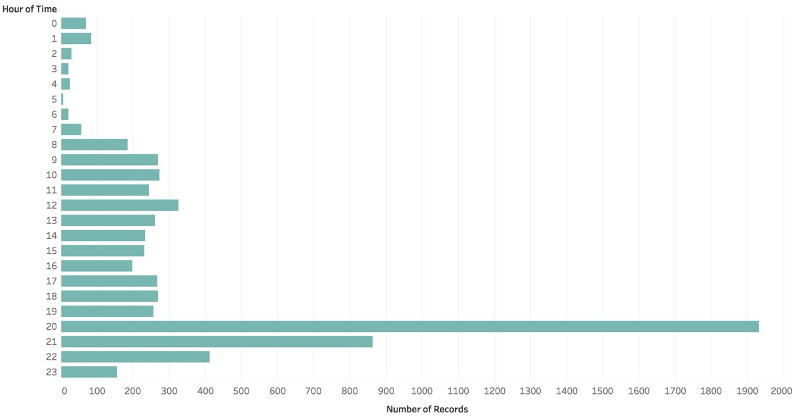
On average, the hour between 8pm and 9pm GMT was when the highest number of tweets were posted, numbered at 5,793 tweets. The lowest number of orginal were tweeted at 5:00 am GMT.
The content analysis was done by looking at the frequencies of most recurring words, tri-grams and quad-grams. The word cloud on the left shows a visualisation of the most used words

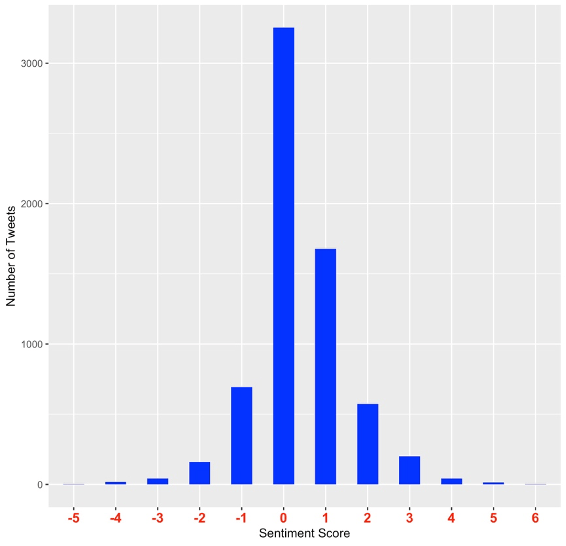
For the sentiment analytics, I ran the data obtained from Google BigQuery through RStudio and as can be seen in the image to the lefts, the majority of the tweets expressed a neutral sentiment (0). The graph shows that another large portion of tweets scores either 1 or -1, which is relatively neutral (Chae, 2014). While there is a lower proportion of the tweets with values of -3 or lower.
